Социограмма
Содержание |
Определение
Социограмма – схематическое изображение реакции испытуемых друг на друга при ответах на социометрический критерий. Социограмма позволяет произвести сравнительный анализ структуры взаимоотношений в группе в пространстве на некоторой плоскости ("щите") с помощью специальных знаков. Социограмма - способ представления, межличностных и межгрупповых отношений в виде системы связей (графа) между индивидами или социальными группами. Анализ социограммы начинается с отыскания центральных, наиболее влиятельных членов, затем взаимных пар и группировок.
Виды социограмм
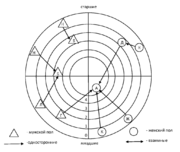
Конвенциональная социограмма. На конвенциональной социограмме индивиды, составляющие группу, изображаются в виде кружочков, соединенных между собой стрелками, символизирующими социометрические выборы или отклонения. При построении конвенциональной социограммы индивиды располагаются по вертикали в соответствии с количеством полученных ими выборов таким образом, чтобы в верхней части социограммы оказались те, кто получил наибольшее количество выборов. Индивидов необходимо располагать на таком расстоянии друг от друга, чтобы оно было пропорционально порядку выбора. Социограмма-мишень. Второй тип групповой социограммы – социограмма-мишень – представляет собой систему концентрических окружностей, количество которых равно максимальному количеству выборов, полученных в группе. Все члены группы располагаются на окружностях в соответствии с количеством полученных выборов. Вся социограмма-мишень делится на секторы по социально-демографическим характеристикам группы (пол, возраст и т. п.).Социограмма как средство исследования
The sociogram is a powerful analysis tool, helping researchers identify points of interest such as clusters (Newman and Girvan 2004), boundary spanners - это такие медиаторы и объединители сообществ (Levina and Vaast 2005), central and peripheral layers (Borgatti and Everett 2000), and other structural properties that otherwise would not be obvious in numeric data (e.g. an adjacency matrix). Today, there are online communities that form around every conceivable topic, so it is no surprise that SNA has become popular for online social network research.
As Freeman note Moreno was the first to propose using that kind of image to reveal important structural information about social linkage patterns, specified general rules for constructing sociograms, and introduced five important ideas about the proper construction of images of social networks: (1) he drew graphs, (2) he drew directed graphs, (3) he used colors to draw multigraphs, (4) he varied the shapes of points to communicate characteristics of social actors, and (5) he showed that variations in the locations of points could be used to stress important structural features of the data.
Социограмма как учебное средство
A sociogram is an easy graphic organizer to help students make connections between people, events, ideas and more.
- Brooks C. A data-assisted approach to supporting instructional interventions in technology enhanced learning environments // 2012.
- Sociograms are a common method of visualizing asynchronous discussions, and have been used by a number of researchers to visualize email correspondence in particular. These visualizations are graphbased structures where nodes represent individuals in the community and arcs between nodes represent the creation of replies to a message. Nodes are typically rendered using different sizes to represent the status of an individual in the community or the amount of discussion the individual has contributed. Nodes can be arranged in a number of ways: a strict hierarchy which outlines the abilities or status of groups
of nodes is common, as is a physics-based \force graph" which moves nodes closer to one another depending on the characteristics they share.
- Брукс о том, что социограммы являются распространенным методом анализа асинхронных коммуникаций, когда исследователи при помощи социограмм визуализируют, например, обмен почтовыми сообщениями. Узлами такой сети являются люди, а ребра или связи между узлами указывают кому отправляется или от кого поступает сообщение.
- Chu K.-H., Wipfli H., Valente T.W. Using Visualizations to Explore Network Dynamics // Journal of Social Structure. 2013. Т. 14.
- Larusson, J.A., White, B.: Learning Analytics: From Research to Practice. Springer (2014). Visualazing Community Interaction
Power of sociograms
- Mehra A. и др. Imaginary Worlds: Using Visual Network Scales to Capture Perceptions of Social Networks // Contemporary Perspectives on Organizational Social Networks Research in the Sociology of Organizations. : Emerald Group Publishing Limited, 2014. С. 315–336.
Two insights prompted us to initiate the development of this method. First, we know that pictorial representations of relationships help researchers make sense of complex social network data (Freeman, 2000). Indeed, the use of graphic imagery to represent relational information was key to the birth of sociometry (Moreno, 1953) and is a core feature of contemporary network analysis (Freeman, 2004). And yet we rarely use network visuals to collect data from respondents (cf. Hogan, Carrasco, and Wellman, 2007). Second, we were interested in developing an approach that would allow us to ask respondents directly about the particular network characteristic that a researcher is interested in rather than soliciting responses at the level of dyadic ties and then inferring the network characteristic of interest. For example, Robert may, when prompted, report that he is connected with A, B, and C and that there are no ties between A, B, and C. A researcher could infer from this information that Robert perceives himself to be a structural bridge connecting A, B, and C. However, it could be the case that, despite perceiving the set of dyadic ties connecting himself to A, B, and C, Robert may have never recognized that he is a bridge between the others in the network. Similarly, a respondent could provide tie-level information that indicates that he sees ties between most people in his group and yet he may never come to the realization that his is a densely connected group. Seeing the trees (i.e., ties) does not mean that one sees the forest (i.e., larger network configurations, such as bridging positions). Evidence from psychology suggests that attention is selective; people do not record individual stimuli, they record underlying patterns (Neisser, 1976). Rather than asking about trees and then inferring which features of the forest the respondent sees, our approach would ask respondents directly about the forest they see (or fail to see).
Human beings are map-makers (Turchi, 2004). We make maps not just of the physical world but also of our social worlds. The maps we construct may at times be horribly skewed and the worlds we envision largely imaginary. Nonetheless, we live in the worlds our maps create. To take this point seriously is not to dissolve the social world but to make it more directly accessible to us.
Средства создания и редактирования социограмм
leaderboardx
http://leaderboardx.herokuapp.com/#/graph-editor Простой и удобный редактор, который позволяет играть с социограммами и понимать что именно они отображают. Можно добавлять узы в окне редактора и указывать, кого выбирает этот агент (список) и кто выбирает этого агента. На основании этих многочисленных взаимных или однонаправленных выборов выстраивается социограмма отношений. Редактор позволяет загружать внешние данные (текстовые и dot файлы) и сохранять результаты - текст и графические svg файлы
VUE
Интерпретация социограмм


