Tidyverse
Материал из Letopisi.Ru — «Время вернуться домой»
Версия от 12:12, 26 марта 2019; Евгений Патаракин (обсуждение | вклад)
Пакет языка R
- Hadley Wickham and Garrett Grolemund - R for Data Science
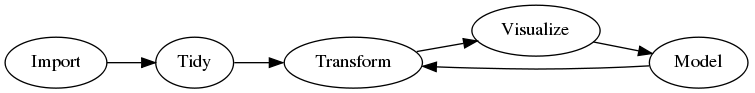
Import, Tidy, Transform, Visualize, and Model Data
- install.packages("tidyverse")
- library(tidyverse)
Содержание |
Import
Tidy
Transform
dplyr Basics
- Pick observations by their values
- (filter()). - filter(flights, month == 1, day == 1)
- Reorder the rows
- (arrange()) - arrange(flights, desc(arr_delay))
- Pickvariables by their names
- (select()). select(flights, year, month, day) select(flights, -(year:day))
- Create new variables with functions of existing variables
- (mutate()). - mutate() always adds new columns at the end of your dataset
- Collapse many values down to a single summary
- (summarize()).
Visualize
ggplot(data = mpg) +
geom_point(mapping = aes(x = displ, y = hwy))
ggplot(data = mpg) +
geom_point(mapping = aes(x = displ, y = hwy, color = class))
ggplot(data = mpg) +
geom_point(mapping = aes(x = displ, y = hwy, size = class))
Facets
ggplot(data = mpg) +
geom_point(mapping = aes(x = displ, y = hwy)) +
facet_wrap(~ class, nrow = 2)
Statistical Transformations
ggplot(data = diamonds) +
geom_bar(mapping = aes(x = cut))
ggplot(data = diamonds) +
stat_count(mapping = aes(x = cut))
Coordinate Systems
- coord_flip() switches the x- and y-axes.
ggplot(data = mpg, mapping = aes(x = class, y = hwy)) +
geom_boxplot() +
coord_flip()